What Is PUE? – Power Usage Effectiveness Explained
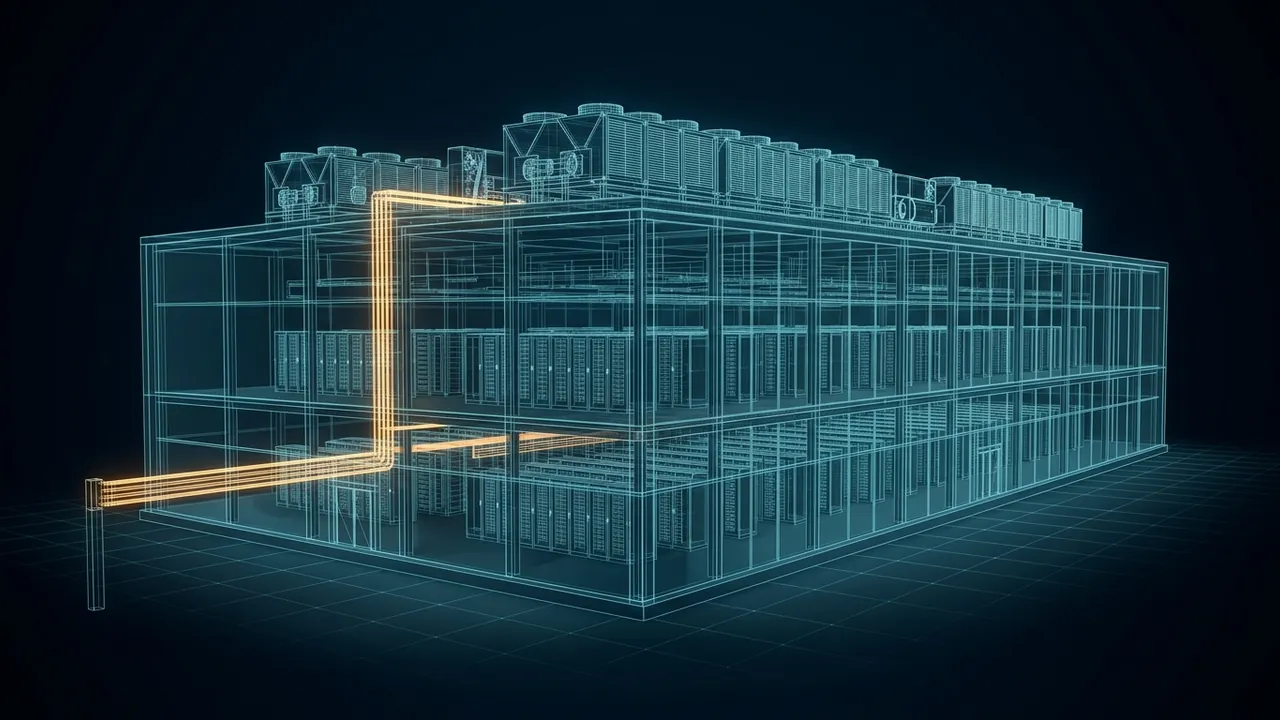
It shows up in data center brochures and near the top of sustainability reports. And every operator has been asked, usually by someone holding a coffee and a clipboard, "So what's your PUE?" It is the most quoted number in the business, yet plenty of smart people are fuzzy on what it actually measures. What is PUE, and how do you know whether a number is any good?
Power usage effectiveness (PUE) is a data center's total facility energy divided by the energy its IT equipment uses. A perfect 1.0 would mean every kilowatt-hour reaches servers, storage and network gear; a 1.5 means 0.5 kWh of overhead for each 1 kWh of IT. Older facilities often run near 2.0, well-run modern sites land around 1.2 to 1.4 and the best large sites approach 1.1. Lower is better, but PUE says nothing about how efficiently the servers themselves work.
How Do You Calculate Power Usage Effectiveness?
You divide total facility energy by IT equipment energy over the same period. The Green Grid, an industry group, introduced the metric in 2007, and it was later published as an international standard, ISO/IEC 30134-2. The Green Grid's white paper, PUE: A Comprehensive Examination of the Metric, is still the reference most engineers point to.
Here is a worked example with simple numbers:
- IT equipment energy for the year: 8,760 megawatt-hours (MWh), which is a steady 1,000 kW load
- Total facility energy, measured at the utility meter or generator output: 12,264 MWh
- PUE = 12,264 ÷ 8,760 = 1.40
That 0.40 is overhead. In this example, 3,504 MWh a year went to chillers, fans, pumps, uninterruptible power supply (UPS) and transformer losses, lighting and everything else that keeps the servers alive. Some people also use the reciprocal, called data center infrastructure efficiency (DCiE): 1 ÷ 1.40 = 71%, meaning 71% of the energy reaches IT gear.
What Counts as IT Load and What Counts as Facility Load?
IT load is the energy consumed by servers, storage, network switches and similar computing gear. Facility load is everything that enters the site, including the IT. Overhead is the difference.
Where you measure IT energy matters. The Green Grid describes measurement points at the UPS output, the power distribution unit output or the server input itself, with the later points giving a more honest number because they exclude more distribution losses. If two sites measure at different points, their PUEs are not quite apples to apples.
Annual PUE vs a Snapshot
A PUE reading can be a single moment or a full year, and the difference is bigger than most people expect. A snapshot taken on a cold January night can look spectacular because the chillers are idle and the economizers are doing the work. The same building on a humid August afternoon might read 0.2 or 0.3 higher.
That is why The Green Grid's guidance favors energy measured over a full year, in kilowatt-hours, rather than a one-time power reading in kilowatts. When someone quotes you a PUE, ask two questions: over what period, and measured where? If the answer is "last Tuesday at the UPS output," take the number with a grain of salt.
Where Does the Overhead Energy Actually Go?
In most facilities, cooling is the biggest slice of overhead by a wide margin. Chillers, cooling tower fans, pumps and air handler fans can together use more energy than everything else outside the IT racks combined.
The next slice is electrical losses. Power passes through transformers, switchgear, UPS systems and power distribution units before it reaches a server, and each step turns a few percent into heat. That heat then has to be cooled too, so electrical losses quietly add to the cooling load. Lighting, security systems, offices and controls make up the small remainder.
What Is a Good PUE?
A good PUE depends on the building's age, size and climate, but here is a fair way to read the numbers.
| PUE | Overhead per 1 kWh of IT | What it usually means |
|---|---|---|
| 2.0 or higher | 1.0 kWh or more | Older room, overcooled, little containment |
| 1.5 to 1.8 | 0.5 to 0.8 kWh | Typical of many existing facilities |
| 1.2 to 1.4 | 0.2 to 0.4 kWh | Well designed and well run |
| Below 1.2 | Under 0.2 kWh | Large, efficient sites using economizers or liquid cooling |
For context, the U.S. Department of Energy's Federal Energy Management Program describes a data center of average energy efficiency as having a PUE of about 2.0. Uptime Institute's annual industry surveys have long put the global average near 1.6. The best large operators report numbers close to 1.1 across whole fleets.
How Much Does PUE Affect Your Power Bill?
A lot, because overhead is paid every hour of the year. The chart below models the yearly overhead energy for a steady 1,000 kW IT load at five different PUE levels. It is simple arithmetic, not survey data.
Energy spent on cooling, power losses and support at each PUE
Model: (PUE − 1) × 1,000 kW × 8,760 hours. Assumes a flat IT load all year.
View the data
| Overhead energy | |
|---|---|
| PUE 1.1 | 876 MWh |
| PUE 1.2 | 1,752 MWh |
| PUE 1.4 | 3,504 MWh |
| PUE 1.6 | 5,256 MWh |
| PUE 2.0 | 8,760 MWh |
At an assumed $70 per MWh, going from a PUE of 1.6 to 1.2 cuts overhead by 3,504 MWh, worth about $245,000 a year for just 1 MW of IT. Multiply by 20 or 50 MW and you see why operators obsess over it. Try your own numbers in the calculator below.
Why Does PUE Matter More for Off-Grid and On-Site Power?
When you build your own power plant, PUE stops being a line on a bill and becomes equipment you must buy. Every unit of overhead is generation capacity, fuel and maintenance.
Say a site has 20 MW of IT load and plans N+1 redundancy with 4 MW generator sets. At a design PUE of 1.5 the facility needs 30 MW, which means 8 running units plus 1 spare, or 9 units. At a PUE of 1.25 it needs 25 MW, which works out to 7 running units (28 MW) plus 1 spare, or 8 units. One fewer engine to buy, fuel and overhaul, just from cooling choices.
Design PUE is usually set for the hottest hours, not the annual average, because the generators must carry the worst case. A site with an annual PUE of 1.2 might hit 1.35 on a July afternoon. Size for the peak, report the average.
Where Can PUE Mislead You?
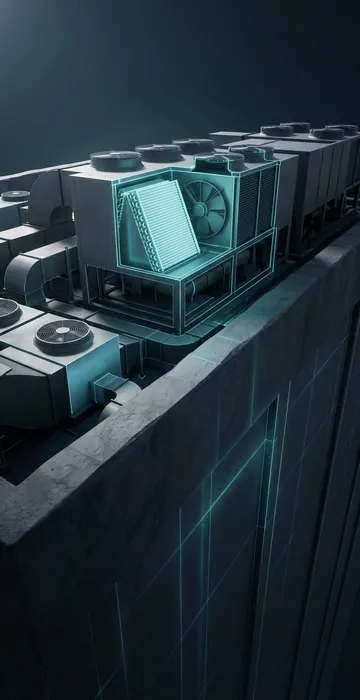
PUE is useful, but it is easy to game or misread. Here are the traps I see most often.
- It ignores IT efficiency. Old, idle servers can make PUE look fine while wasting most of the energy that reaches them.
- Server fans count as IT. Raising room temperature makes server fans spin faster. That moves energy from the facility column to the IT column, which can improve PUE even if total energy goes up.
- Low utilization hurts. A half-empty hall still runs much of its cooling and power plant, so PUE looks worse during ramp-up.
- Climate matters. A site in a cool climate gets free cooling much of the year. Comparing it with a site in a desert is not quite fair.
- Water is invisible. Evaporative cooling lowers PUE by trading electricity for water.
That last point is a big one. A site can show an excellent PUE while evaporating large volumes of water, which is why serious operators track data center water usage alongside energy.
How Do Data Centers Improve Their PUE?
Most improvements come from cooling, because that is where most overhead lives. The usual playbook, roughly from cheapest to most expensive:
- Seal gaps with blanking panels and contain hot or cold aisles.
- Raise supply air temperature toward the upper part of ASHRAE's recommended range.
- Add variable-speed drives to fans and pumps.
- Use economizers for free cooling when the weather allows.
- Pick higher-efficiency UPS systems and transformers.
- Move dense loads to liquid cooling.
The first two cost little and often pay back within months. The last few belong in the design of a new site.
What Power Usage Effectiveness Can and Can't Tell You
The most useful thing PUE does is put a price on overhead. The gap between 1.6 and 1.2 is worth real money, real fuel and, at an on-site power plant, real equipment you never have to buy.
Pull a full year of meter data, calculate your annual number and trend it month by month. Use power usage effectiveness to size generation honestly for the hottest hours, but do not treat it as the whole story. Pair it with water use, server utilization and the cost of each megawatt-hour, and you will have a much clearer picture of how well a facility actually runs.